
Visualizing point clouds with RViz2 and Python
NOTE: This post is slightly outdated. I’ve updated the Github repo this, and it now also demonstrates how to subscribe to PointCloud2 messages.
While trying to learn how to use ROS2 and in extension RViz2 I discovered that there is a severe lack of documentation on how to use it with Python. Therefore I thought that I could write some ROS2 Pythons tutorials while I learn. In that way, you don’t have to suffer the way I did ;)
In this tutorial I will show you how to convert a Numpy array into a PointCloud2 message, publish it, and visualize it using RViz.
Prerequisites
If you are a complete beginner on ROS, I highly suggest that you first do the Beginner: CLI Tools tutorials on the ROS2 website. It will give you a basic understanding of the fundamentals of how ROS2 works.
I can also recommend this GitHub repo that my PhD supervisor Lars Tingelstad made. It is a small ROS2 tutorial on how to simulate a robot arm using RViz.
Let’s get started!
(Note: All source code is available in this GitHub repo, but you should be able to replicate it entirely by following this tutorial. )
I assume that you already have a workspace with a src folder. In that folder, create a package by running:
ros2 pkg create --build-type ament_python --node-name pcd_publisher_node pcd_publisher
This will create the file pcd_publisher/pcd_publisher_node.py which is where we will do most of our work. The entire code is in the spoiler below, but I’ll go through the important components.
pcd_publisher_node.py
import sys
import os

import rclpy
from rclpy.node import Node
import sensor_msgs.msg as sensor_msgs
import std_msgs.msg as std_msgs

import numpy as np
import open3d as o3d

class PCDPublisher(Node):

    def __init__(self):
        super().__init__('pcd_publisher_node')

        # This executable expectes the first argument to be the path to a
        # point cloud file. I.e. when you run it with ros:
        # ros2 run pcd_publisher pcd_publisher_node /path/to/ply
        assert len(sys.argv) > 1, "No ply file given."
        assert os.path.exists(sys.argv[1]), "File doesn't exist."
        pcd_path = sys.argv[1]

        # I use Open3D to read point clouds and meshes. It's a great library!
        pcd = o3d.io.read_point_cloud(pcd_path)
        # I then convert it into a numpy array.
        self.points = np.asarray(pcd.points)
        print(self.points.shape)

        # I create a publisher that publishes sensor_msgs.PointCloud2 to the
        # topic 'pcd'. The value '10' refers to the history_depth, which I
        # believe is related to the ROS1 concept of queue size.
        # Read more here:
        # http://wiki.ros.org/rospy/Overview/Publishers%20and%20Subscribers
        self.pcd_publisher = self.create_publisher(sensor_msgs.PointCloud2, 'pcd', 10)
        timer_period = 1/30.0
        self.timer = self.create_timer(timer_period, self.timer_callback)

        # This rotation matrix is used for visualization purposes. It rotates
        # the point cloud on each timer callback.
        self.R = o3d.geometry.get_rotation_matrix_from_xyz([0, 0, np.pi/48])


    def timer_callback(self):
        # For visualization purposes, I rotate the point cloud with self.R
        # to make it spin.
        self.points = self.points @ self.R
        # Here I use the point_cloud() function to convert the numpy array
        # into a sensor_msgs.PointCloud2 object. The second argument is the
        # name of the frame the point cloud will be represented in. The default
        # (fixed) frame in RViz is called 'map'
        self.pcd = point_cloud(self.points, 'map')
        # Then I publish the PointCloud2 object
        self.pcd_publisher.publish(self.pcd)

def point_cloud(points, parent_frame):
    """ Creates a point cloud message.
    Args:
        points: Nx3 array of xyz positions.
        parent_frame: frame in which the point cloud is defined
    Returns:
        sensor_msgs/PointCloud2 message

    Code source:
        https://gist.github.com/pgorczak/5c717baa44479fa064eb8d33ea4587e0

    References:
        http://docs.ros.org/melodic/api/sensor_msgs/html/msg/PointCloud2.html
        http://docs.ros.org/melodic/api/sensor_msgs/html/msg/PointField.html
        http://docs.ros.org/melodic/api/std_msgs/html/msg/Header.html

    """
    # In a PointCloud2 message, the point cloud is stored as an byte
    # array. In order to unpack it, we also include some parameters
    # which desribes the size of each individual point.


    ros_dtype = sensor_msgs.PointField.FLOAT32
    dtype = np.float32
    itemsize = np.dtype(dtype).itemsize # A 32-bit float takes 4 bytes.

    data = points.astype(dtype).tobytes()

    # The fields specify what the bytes represents. The first 4 bytes
    # represents the x-coordinate, the next 4 the y-coordinate, etc.
    fields = [sensor_msgs.PointField(
        name=n, offset=i*itemsize, datatype=ros_dtype, count=1)
        for i, n in enumerate('xyz')]

    # The PointCloud2 message also has a header which specifies which
    # coordinate frame it is represented in.
    header = std_msgs.Header(frame_id=parent_frame)

    return sensor_msgs.PointCloud2(
        header=header,
        height=1,
        width=points.shape[0],
        is_dense=False,
        is_bigendian=False,
        fields=fields,
        point_step=(itemsize * 3), # Every point consists of three float32s.
        row_step=(itemsize * 3 * points.shape[0]),
        data=data
    )

def main(args=None):
    # Boilerplate code.
    rclpy.init(args=args)
    pcd_publisher = PCDPublisher()
    rclpy.spin(pcd_publisher)

    # Destroy the node explicitly
    # (optional - otherwise it will be done automatically
    # when the garbage collector destroys the node object)
    pcd_publisher.destroy_node()
    rclpy.shutdown()

if __name__ == '__main__':
    main()
First, we need to import the following libraries:
import sensor_msgs.msg as sensor_msgs
import std_msgs.msg as std_msgs
They provide the classes PointCloud2 and Header which we need in order to construct our point cloud packet. The gist of the node constructor is that I import the point cloud from a .ply file, create a publisher and specify timer that will run the callback function 30 times a second:
class PCDPublisher(Node):
    ...
    pcd = o3d.io.read_point_cloud(pcd_path)
    self.points = np.asarray(pcd.points)
    self.pcd_publisher = self.create_publisher(sensor_msgs.PointCloud2, 'pcd', 10)
    timer_period = 1/30.0
    self.timer = self.create_timer(timer_period, self.timer_callback)
When the callback function is called, it converts the Numpy array into a PointCloud2 message and publishes it using the publisher we created in the constructor.
def timer_callback(self):
    ...
    self.pcd = point_cloud(self.points, 'map')
    self.pcd_publisher.publish(self.pcd)
Most of the things is performed by the point_cloud() function which I found in a Gist by @pgorczak which I’ve modified slightly. It takes in an Nx1 Numpy array, and the name of the parent frame as a string.
def point_cloud(points, parent_frame):

    ros_dtype = sensor_msgs.PointField.FLOAT32
    dtype = np.float32
    itemsize = np.dtype(dtype).itemsize # A 32-bit float takes 4 bytes.

    data = points.astype(dtype).tobytes()

    # The fields specify what the bytes represents. The first 4 bytes
    # represents the x-coordinate, the next 4 the y-coordinate, etc.
    fields = [sensor_msgs.PointField(
        name=n, offset=i*itemsize, datatype=ros_dtype, count=1)
        for i, n in enumerate('xyz')]

    # The PointCloud2 message also has a header which specifies which
    # coordinate frame it is represented in.
    header = std_msgs.Header(frame_id=parent_frame)

    return sensor_msgs.PointCloud2(
        header=header,
        height=1,
        width=points.shape[0],
        is_dense=False,
        is_bigendian=False,
        fields=fields,
        point_step=(itemsize * 3), # Every point consists of three float32s.
        row_step=(itemsize * 3 * points.shape[0]),
        data=data
    )
The most important part of this code is data = points.astype(dtype).tobytes(). Your data needs to be a 32-bit float because otherwise it will not show up in RViz. Instead, you will get an error saying: “No position transformer available for cloud”. It took me quite a bit of googling before figuring that out.
A PointCloud2 message consists of a header, a data field, and some descriptors which describe how the data is represented (See the documentation). The point cloud is represented as a byte array where every 12 bytes represents a point. The fields descriptor specifies that the first 4 bytes of those 12 represent the x-coordinate, the next for the y-coordinate, etc.
Build and run
Move to the root of the workspace, e.g. cd ~/dev_ws. Then compile the package using colcon.
colcon build --symlink-install --packages-select pcd_publisher
The purpose of --symlink-install is that it allows us to do changes to our Python code without having to recompile every time. Now you can run the node!
If you are using the code from my GitHub you can run it in two ways:
Run the demo using a launch file (automatically starts RViz):
ros2 launch pcd_publisher pcd_publisher_demo.launch.py
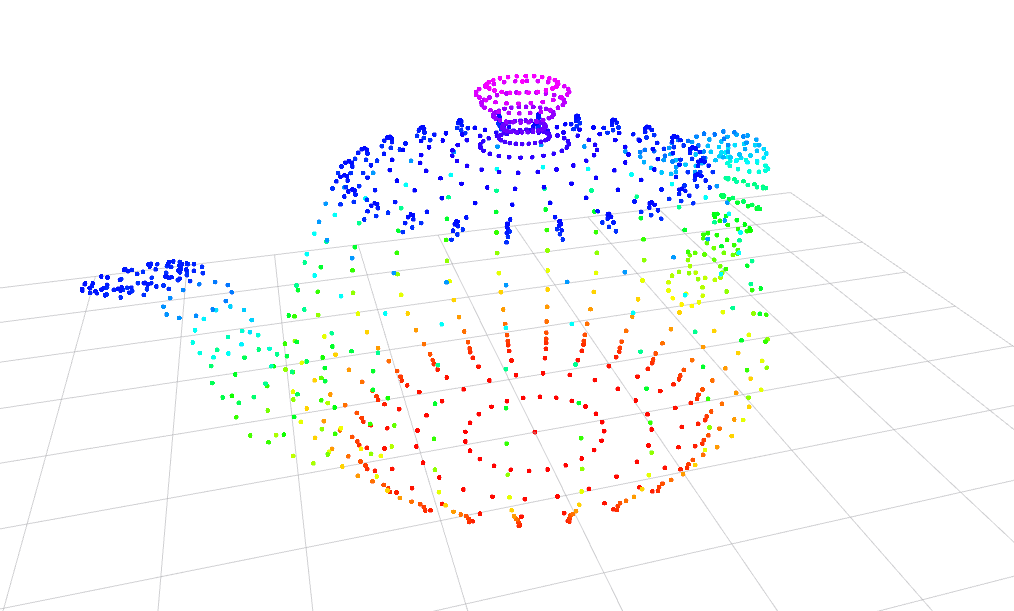
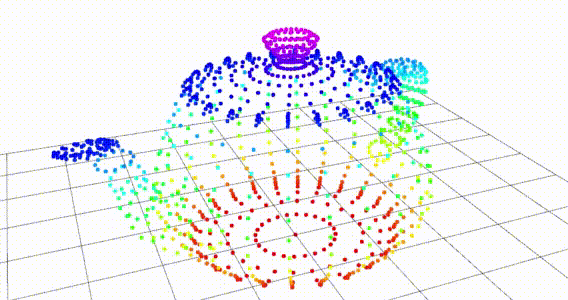
RViz should now show a spinning Utah teapot!
Run the demo manually:
ros2 run pcd_publisher pcd_publisher_node ~/dev_ws/src/pcd_publisher/resource/teapot.ply
In a new terminal:
ros2 run rviz2 rviz2
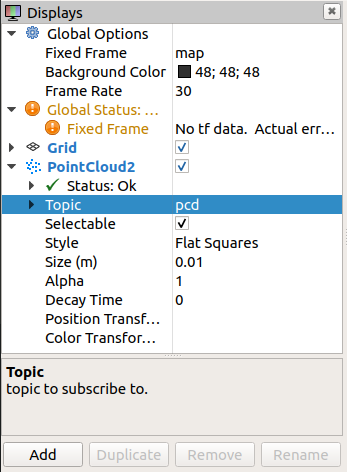
Make sure the Displays panel is visible Panels > [✔] Displays. Then, in the lower corner, press Add and select PointCloud2. In the list, expand PointCloud2 and specify pcd as the topic (see figure below).
RViz should now show a spinning Utah teapot!
Cheers!
// Sebastian